
Investment Management
Our Mission
Our team of seasoned investment management professionals utilizes a comprehensive approach to identify and analyze potential investment opportunities across various asset classes. We construct well-diversified portfolios tailored to our clients' specific financial goals and risk tolerance. Through disciplined weight of the evidence risk management and ongoing monitoring, we strive to optimize returns while navigating the complexities of the ever-evolving global financial landscape.
Our Philosophy
Find the signal through the noise: Follow the data and not the hype.
We are risk managers: We cannot control returns, but we can control how much risk we are taking.
Risk is not static: Adjusting portfolio risk based on the data should (but not always) add value.
Returns are mean reverting: What goes up, must come down and vice versa.
Valuations matter: Overvalued assets present greater risks than undervalued assets.
Core factors matter: Quality, Value, Dividends, Momentum & Size
Diversification is the only free lunch: Lowers risk and increases returns in most market cycles (but not all).
Why Diversified Portfolios
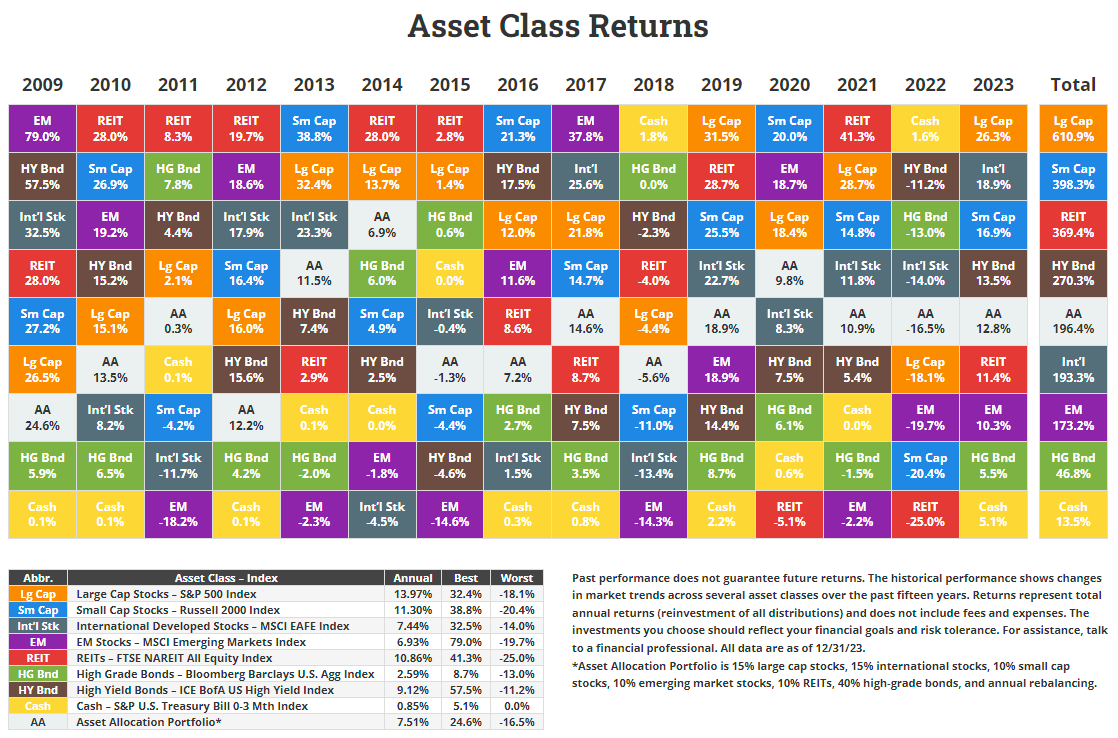
Diversified Portfolios (represented by AA on the chart below) manage risks by investing in multiple asset categories eliminating extreme performance in either direction.
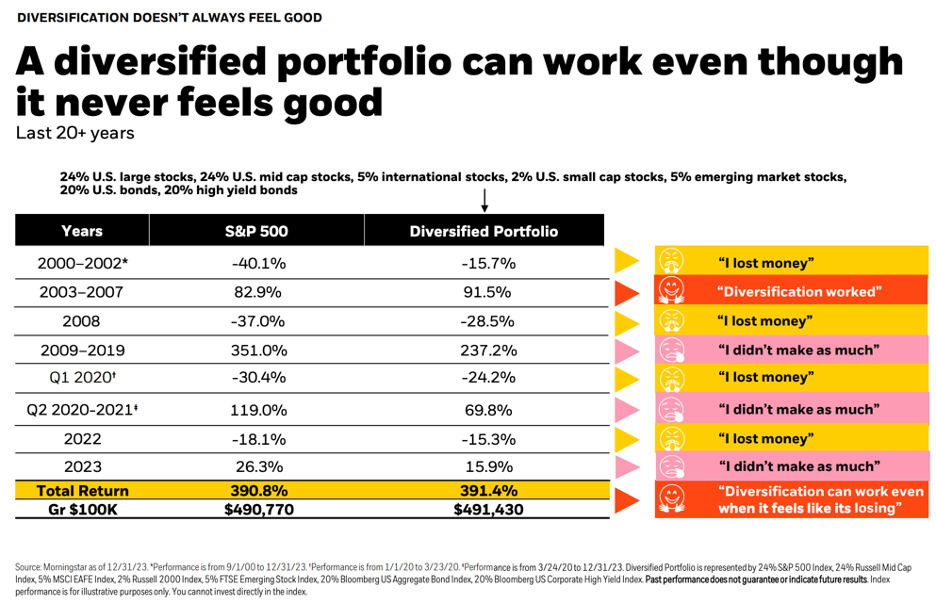
Below is a piece by Morningstar highlighting that even when diversified portfolios don’t feel like they are working, they are, it just takes time. Their power is in their downside protection. Example: If you start with $100 and lose 10% you are left with $90. What happens if you then gain 10%? You end up with $99.
Let’s Check Out How Our Portfolios Are Structures
We offer three different risk profiles. Click on the charts to see the long term target allocation for each model.
Conservative
Moderate
Aggressive
Each model is available in three different “flavors”

Risk Management
We use 49 indicators to help us determine how much stock exposure we should use within each model. Most indicators fall within the following areas: Trends, Valuations, Monetary & Sentiment. We use 49 indicators to get the “weight of the evidence” to prevent blindspots.
Below is 1 of the 49 indicators that we use. It is called “Don’t Fight The Tape Or The Fed”. This indicator combines both Trend and Monetary data. The top of the chart shows the performance of the S&P 500. The center of the chart is the indicator that is broken up into five sections ranging from +2 to -2. As you can see at the bottom of the chart, the S&P 500 has performed best with the indicator is at +2. In this range both the trend and monetary data support taking risk. At the other extreme, -2 both trend and monetary data support reducing risk.

Below is another one of the 49 indicators that we use. It is called “NDR Multi-Cap Stock Index vs. NDR Multi-Cap Median P/E”. This indicator focuses on valuation data. The top of the chart shows the performance of the Multi-Cap Stock Index. The center of the chart is the indicator that is broken up into three section tracking the price-to-earnings (P/E) of the index. When the indicator is above 22.5 the stock index is considered overvalued. When below 14.5 the stock index is considered to be a bargain. As you can see at the bottom of the chart, the index performs best when stocks are a bargain. This is when we want to increase risk. The opposite is true when stocks are overvalued.
