

2Q2026 Quarterly Insights Newsletter
U.S. Equities
Main Points
-
The S&P 500 rose 14.9%, its best quarterly gain in six years with Growth stocks rebounding strongly.
-
In contrast to Q1, leadership narrowed meaningfully which was a reversal from earlier this year.
-
Historically, quarterly gains above 12% have been followed by further upside.
U.S. Sectors
Main Points
-
Tech surged 31.6% in Q2 on AI spending, while Energy declined 14.03% as crude prices fell.
-
Industrials emerged as the most consistent performer, finishing the first half as the top sector overall.
-
Sector performance in Q2 reflected a sharp rotation from Q1, with leadership shifting significantly.
U.S. Economy & Fixed Income
Main Points
-
The U.S. economy in Q2 was defined by a shift toward more persistent inflation.
-
Inflation accelerated through the first half of the year, with headline PCE reaching 4.1% in May.
-
Fixed income markets delivered modest returns in Q2, with the U.S. Aggregate Index gaining 0.7%.
International Equities
Main Points
-
Global equities rebounded strongly in Q2, with the MSCI ACWI rising 14.7% and bringing first half returns to 11.3%.
-
Emerging Markets led, gaining 23.4% in Q2 and 25.6% year to date, driven largely by semiconductor strength in South Korea and Taiwan.
-
Despite the strong headline performance, underlying breadth remained mixed.
Commodities
Main Points
-
Commodity markets in Q2 remained supported by a favorable macro backdrop, though momentum softened.
-
Despite this support, shorter-term trends have weakened and commodity breadth has deteriorated.
-
Global liquidity remains supportive, but the peak in central bank easing breadth appears to have passed.
Q2 Asset Class Benchmark Returns
Q2 S&P 500 Sector Returns
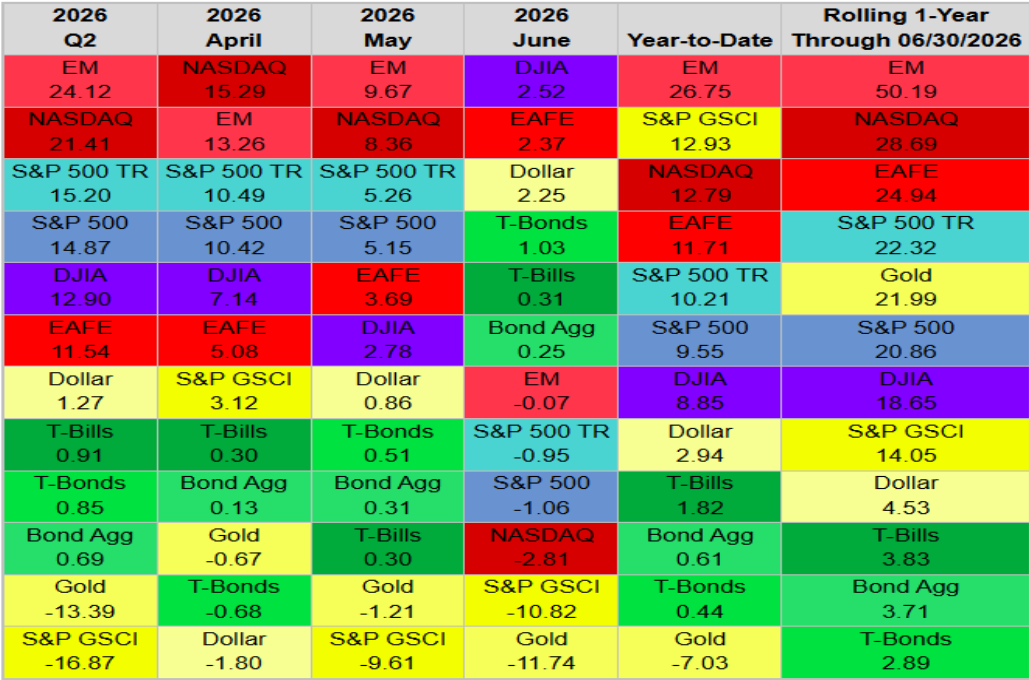
The second quarter marked a sharp reversal from Q1, with the S&P 500 rising 14.9%, its best quarterly gain in six years. Growth stocks rebounded strongly, led by semiconductors, as the AI trade regained momentum and pushed the Technology sector, Nasdaq, and broader index to new highs.
In contrast to Q1, leadership narrowed meaningfully. The percentage of stocks outperforming the index fell to its second-lowest reading on record, a sharp reversal from the roughly 55% breadth seen earlier in the year, highlighting increased concentration in large-cap names. At the same time, commodities and Energy lagged as WTI posted its steepest decline since Q3 2022, weighing on related sectors and export-driven markets.
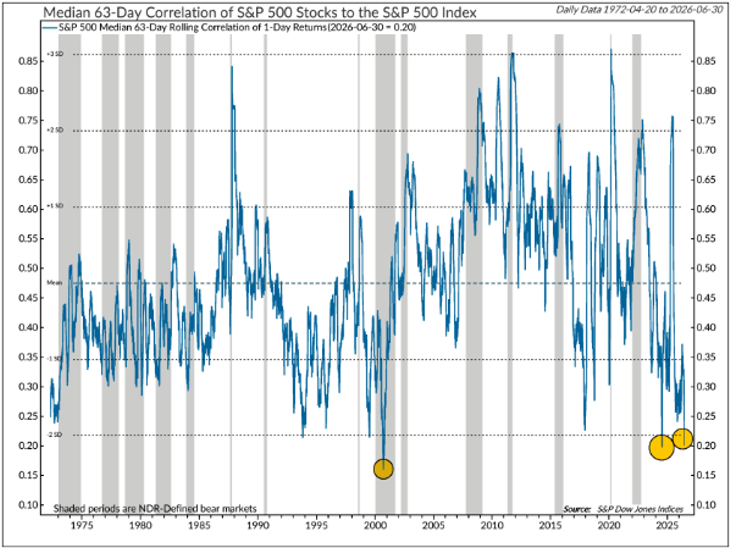
Despite shifting leadership, dispersion remained elevated. Median stock correlation to the S&P 500, which measures how closely individual stock returns move together with the broader market and reflects the degree of variability across stocks, dropped to 0.21 (chart below). This is the third-lowest level since 1972 and well below the long-term average. Still, underlying participation remained supportive, with 60.9% of stocks above their 200-day moving averages, signaling resilience beneath the surface.
Historically, quarterly gains above 12% have been followed by further upside, with the S&P 500 rising about 75% of the time and delivering a median gain near 10% over the next two quarters.
However, the backdrop is becoming more complex as investors look ahead to a potentially more hawkish Federal Reserve. Expectations for rate hikes later in the year introduce uncertainty, with past tightening cycles showing muted returns and volatility. Earnings stability also has come into question. The percentage of S&P 500 market capitalization with positive earnings revisions hit a high 63.9% in May before moving to 63.6% in June.
Correlation among S&P 500 stocks near record low
Source: Ned Davis Research (NDR)
Sector performance in Q2 reflected a sharp rotation from Q1, with leadership shifting significantly across industries. Technology rebounded strongly after a 9.3% decline in Q1, rising 31.6% in Q2, its best quarterly gain since Q4 2001 and one of its strongest since 1972, driven by renewed momentum in AI-related spending and semiconductor demand. In contrast, Energy moved from the top performer in Q1 to the worst in Q2, declining 13.5% as crude prices fell on easing geopolitical tensions and progress in U.S. and Iran negotiations. Despite this reversal, Energy still ranked as the third-best sector for the first half of the year, highlighting the magnitude of intra-year rotation.
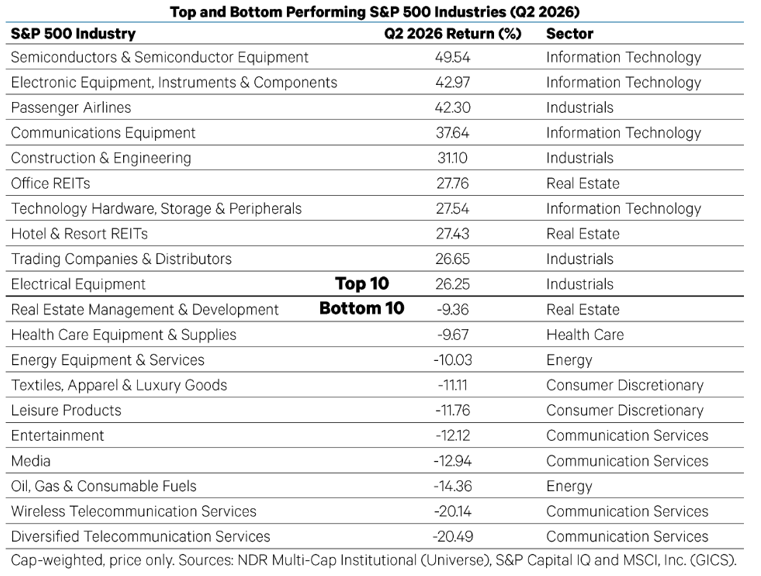
Industrials emerged as the most consistent performer, finishing the first half as the top sector overall, supported by infrastructure and capital expenditure trends. Technology and Industrials each contributed four of the top-performing industries in Q2, while Real Estate added two (table below). At the industry level, returns were highly dispersed. Semiconductors led with a 49.5% gain, supported by outsized moves in names such as Micron, AMD, and Intel. Within Technology, performance diverged sharply, with hardware and semiconductor-related industries posting gains of over 40% while Software and IT Services declined 20% and 25%, respectively, amid concerns around AI disruption. In total, 25 of 67 industries posted losses in the first half.
Rotation remained a defining feature of the market. Multiple sectors, including Utilities, Health Care, and Consumer Discretionary, moved between top and bottom performers throughout the year. While eight sectors experienced drawdowns greater than 10%, the S&P 500 avoided a correction in the first half. At the same time, correlations across sector groups fell sharply, with cyclical Growth and cyclical Value correlation dropping to 0.4, near historical lows, reinforcing the highly differentiated market environment.
Semis took the top spot in Q2
Source: Ned Davis Research (NDR)
The U.S. economy in Q2 was defined by a shift toward more persistent inflation and a decisively hawkish Federal Reserve under new Chairman Warsh. Inflation accelerated through the first half of the year, with headline PCE inflation reaching 4.1% in May and core rising to 3.4%, both the highest levels since 2023. PCE tracks overall consumer prices, while core inflation excludes food and energy. This increase was driven in part by elevated energy prices following geopolitical disruptions, though easing oil prices late in the quarter suggest inflation may have peaked. Still, inflation is expected to remain elevated near 3.5% in the second half.
In response, the Fed signaled a clear commitment to price stability, revising its 2026 inflation forecasts higher and indicating at least one rate hike this year. Despite the hawkish pivot, real policy rates remain near neutral, supported by still-loose financial conditions. This suggests the Fed retains flexibility to tighten policy without immediately derailing economic growth, keeping the broader macro backdrop stable but increasingly sensitive to inflation dynamics.
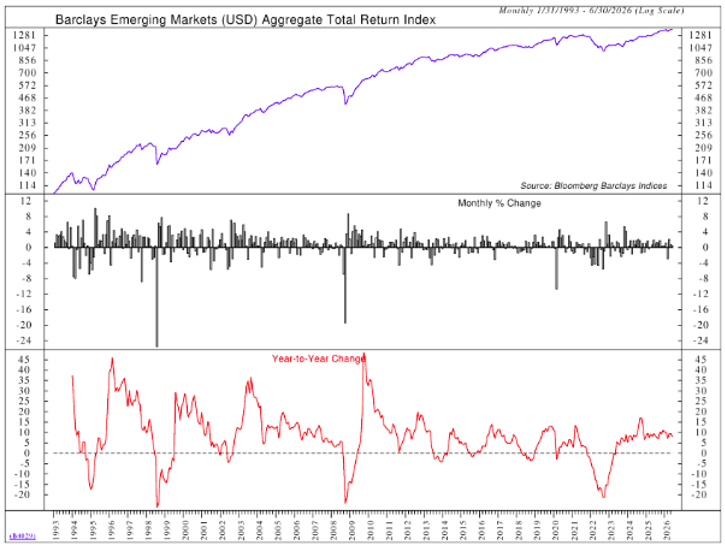
Fixed income markets delivered modest returns in Q2, with the U.S. Aggregate Index gaining 0.7% as yields remained range-bound amid easing inflation concerns and expectations for a more hawkish Federal Reserve. In a no-recession environment, credit outperformed, led by emerging market debt at 3.4% (chart below), followed by high yield at 2.5% and leveraged loans at 1.9%.
Municipal bonds also performed well, rising 2.5%. Global bonds saw mixed results, with currency movements driving outcomes for U.S. investors. A stronger yuan and stable pound boosted returns, while euro and yen weakness reduced gains. Leadership of emerging market bonds in Q2 2026 was driven by robust risk appetite, favorable macroeconomic conditions, currency dynamics benefiting USD-based investors, and strong performance by EM high yield debt.
Emerging markets was the best performing sector
Source: Ned Davis Research (NDR)
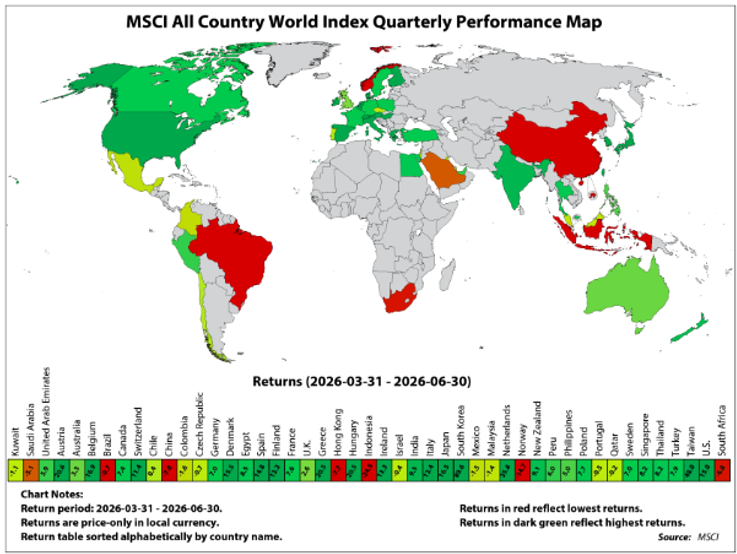
Global equities rebounded strongly in Q2, with the MSCI All-Country World Index (ACWI) rising 14.7% and bringing first half returns to 11.3%. The recovery followed a weak Q1 driven by geopolitical tensions and was supported by easing concerns around the Iran conflict and a renewed AI-led rally. However, performance was uneven, with 15 of 47 markets posting negative returns, highlighting persistent regional divergence.
Emerging Markets led, gaining 23.4% in Q2 and 25.6% year to date, driven largely by semiconductor strength in South Korea and Taiwan (chart below). U.S. equities rose 15%, broadly in line with global markets, while Pacific ex Japan and the U.K. lagged, each rising just over 2%. Sector leadership also shifted meaningfully. Energy reversed sharply, falling 13.4% after a strong Q1, while Information Technology surged 39.2%, led by a 58.6% gain in semiconductors. Financials and Industrials also posted solid gains as risk appetite improved.
Despite the strong headline performance, underlying breadth remained mixed. Within Emerging Markets, variability of returns was pronounced, with several commodity-linked markets underperforming as oil prices declined. China lagged, falling 7.8% in Q2 and 15.7% for the first half, weighed down by weak domestic demand despite gains in semiconductor-related sectors.
In Europe, performance varied based on sector exposure, with semiconductor-heavy markets outperforming while energy-sensitive markets lagged. Japan continued to show resilience, supported by strong domestic fundamentals and a weaker yen, finishing the first half up 18.9%.
Overall, while global equities regained momentum in Q2, the environment remains highly differentiated, with leadership concentrated in select sectors and regions.
South Korea and Taiwan top-performers in Q2
Source: Ned Davis Research (NDR)
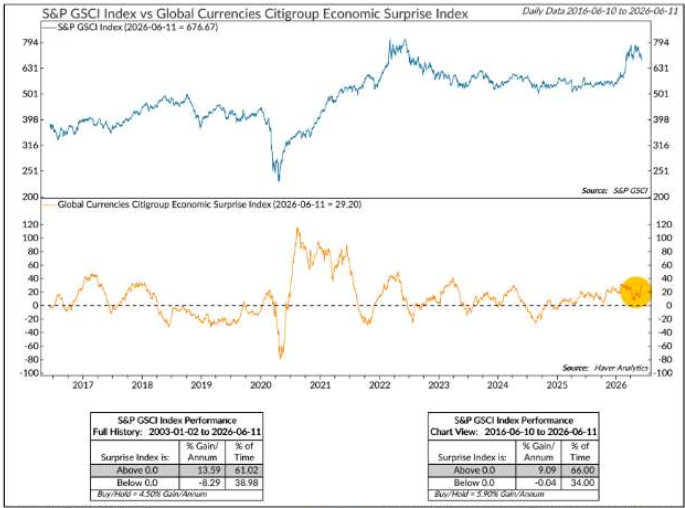
Commodity markets in Q2 remained supported by a favorable macro backdrop, though momentum softened as the quarter progressed with the S&P GSCI Index declining 16.87%. Recession risk remains low, and global growth indicators continue to point to expansion, with manufacturing PMI breadth still comfortably above levels historically associated with constructive commodity performance. Positive economic surprise data has also supported demand expectations, although readings are no longer accelerating, suggesting a more balanced macro outlook (chart below).
Despite this support, shorter-term trends have weakened. Commodity breadth has deteriorated, with the share of assets trading above both 50-day and 200-day moving averages declining, and fewer commodities maintaining upward momentum. The S&P GSCI Index remains above its 200-day moving average, indicating that the longer-term uptrend is intact. However, the index has slipped below key shorter-term averages, signaling a loss of near-term momentum. This softening follows a failed attempt to break above prior highs, with the index peaking near 777 in Q2, well below its historical peak near 890.
Falling oil prices weighed heavily on commodities, given the energy-heavy composition of the S&P GSCI Index. As crude declined, it dragged the broader index lower, reinforcing the linkage between energy markets and performance.
The environment reflects a transition from broad strength to a more fragile setup. Global liquidity remains supportive, but the peak in central bank easing breadth appears to have passed, and currency trends are becoming less supportive.
While the recent pullback has been accompanied by increasingly pessimistic sentiment, suggesting the potential for a near-term rebound, confirmation would require stabilization in breadth and a reversal in short-term trends.
A trend of surprises support broad commodity prices
Source: Ned Davis Research (NDR)
Source: Ned Davis Research (NDR)

Source: Ned Davis Research (NDR)