2Q2025 Quarterly Insights Newsletter
U.S. Equities
Main Points
-
From its February highs, the S&P 500 recorded the fastest recovery from a correction of at least 15%.
-
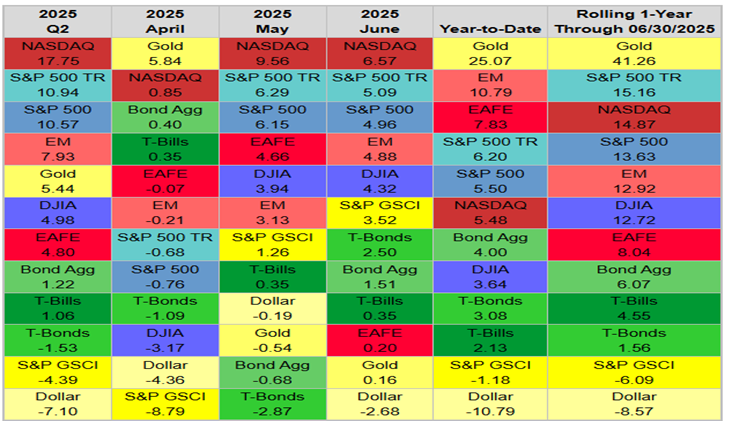
The Nasdaq surged 17.8% in Q2, while gold rose 24.3% year-to-date.
-
Commodities were mixed, with only eight out of 17 tracked commodities posting year-to-date gains.
U.S. Sectors
Main Points
-
Tech, Communication Services, and Consumer Discretionary drove 9.8 percentage points of the S&P 500’s 10.6% Q2 gain.
-
Growth outperformed Value across all market caps in Q2, with mid-cap Growth leading.
-
Despite geopolitical tensions, Fed policy uncertainty, and volatility, Q1 earnings quietly showed solid performance.
U.S. Economy & Fixed Income
Main Points
-
Trump’s tariff chaos hurt confidence, but offsets include tax cuts and delayed spending cuts.
-
A weaker U.S. dollar boosted international returns, with the Global Aggregate soaring 4.6%.
-
In Q2, bonds delivered moderate gains, with the U.S. Aggregate rising 1.2%, less than half of Q1’s performance.
International Equities
Main Points
-
International benchmarks such as the EAFE and Emerging Markets indices outperformed the U.S.
-
Sentiment, rather than fundamentals, may continue to drive market behavior. Caution is warranted as we enter 2H.
-
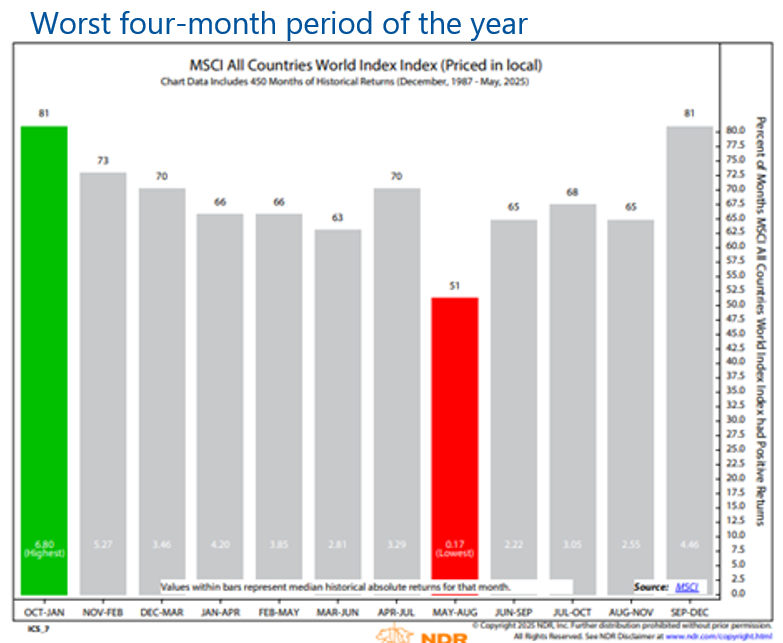
Seasonality also adds further risk. August and September have been historically weak months.
Q2 Asset Class Benchmark Returns
Q2 S&P 500 Sector Returns
The second quarter of 2025 delivered one of the most dramatic market reversals in recent history. Following President Trump’s Liberation Day tariff announcement, the S&P 500 fell 10% over two trading days, marking just the fourth such drop since World War II. Despite the steep fall, the rebound was even more historic. The index’s 12.1% slide from April 2 to April 8 was the largest intra-quarter correction to be completely erased within the same quarter since at least 1928. From its February highs, the S&P 500 recorded the fastest recovery from a correction of at least 15% (table below).
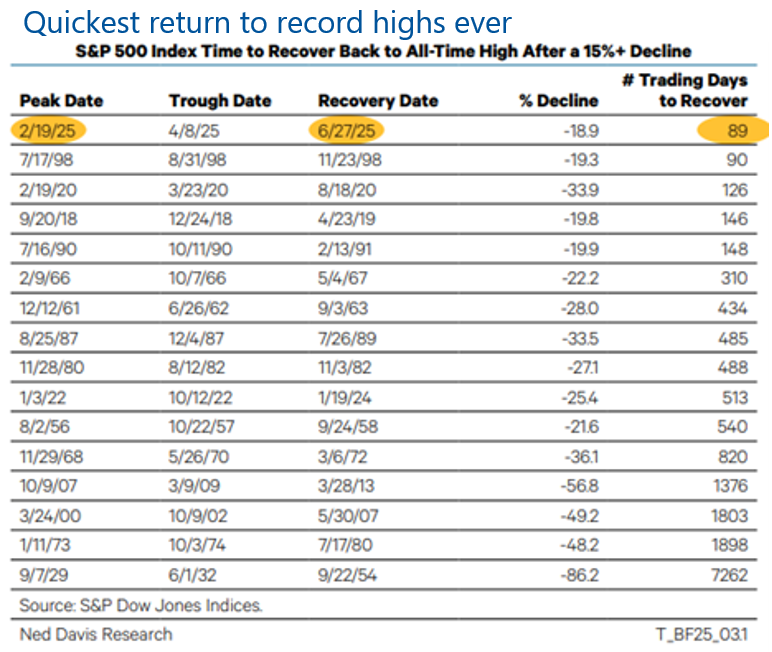
Source: Ned Davis Research (NDR)
While the 18.9% decline was modest in historical terms, the speed of the recovery stood out, especially when compared to episodes in 1990 and 2018. The index ended Q2 with a gain of 10.6%, its best quarter since Q4 2023 and the eleventh-best quarterly return in 25 years. Market leadership rotated significantly across investment styles and regions. After trailing the Russell 1000 Value Index by 12.1% in Q1, the Russell 1000 Growth Index outperformed Value by 14.2% in Q2, marking the largest quarterly turnaround since late 1999.
The U.S. Dollar Index declined 10.8% in the first half, its worst start since at least 1979, with losses continuing into June. The Nasdaq surged 17.8% in Q2. In Q2, U.S. equities outperformed both Europe and Emerging Markets equity benchmarks. Gold delivered a standout performance, rising 24.3% in the first half of the year, its strongest start since 1974. Commodities were mixed, with only eight out of 17 tracked commodities posting year-to-date gains. Crude oil, in particular, weighed on broad commodity indexes with an 11.5% year-to-date decline. Cash remained at the lower end of the performance spectrum, with T-bills returning 2.1% in the first half of the year, outpacing only a few asset classes.
Ultimately 2H25 could offer continued upside for U.S. equities, though high valuations and geopolitical risks increase volatility.
The S&P 500 delivered another strong month in June, gaining nearly 5% and closing at a record high. This capped a powerful second-quarter rally, reversing all losses from the post-Liberation Day selloff. Technology, Communication Services, and Consumer Discretionary drove 9.8 percentage points of the S&P 500’s 10.6% Q2 gain, with Technology alone rising 9.7% in June and contributing over 60% of the month’s return. Communication Services followed with a 7.2% gain. Alongside Industrials and Financials, these sectors also reached new all-time highs since the April low.
Growth outperformed Value across all market caps in Q2, with mid-cap Growth leading. Much of the market’s correction took place in Q1 while the recovery took place in Q2, leading to more mixed leadership in the 1H. Industrials and Communication Services were the only sectors up double digits in the first half, while Consumer Discretionary, Health Care, and Energy are the only sectors to finish with losses.
With headlines dominated by Middle East tensions, Fed policy, and market volatility, Q1 earnings largely flew under the radar. Now that the dust is settling, a closer look shows solid performance. With 98% of S&P 500 companies reporting, the beat rate reached 79% (chart below). This was better than the past two quarters, though only the fourth highest in the last eight.
While not exceptional, earnings were strong enough to support the market rebound. Sector results were mixed. Looking ahead, Technology is expected to drive the bulk of earnings growth for the S&P 500. Of the expected 7.1% earnings growth for 2025, the top 10 contributors make up 4.6 points. Nvidia leads with 1.5 points, far ahead of others. All top contributors come from Technology, the Magnificent 7, or Health Care, showing the market’s dependence on a few key names. Broader sector participation will likely be needed to sustain the bull market.
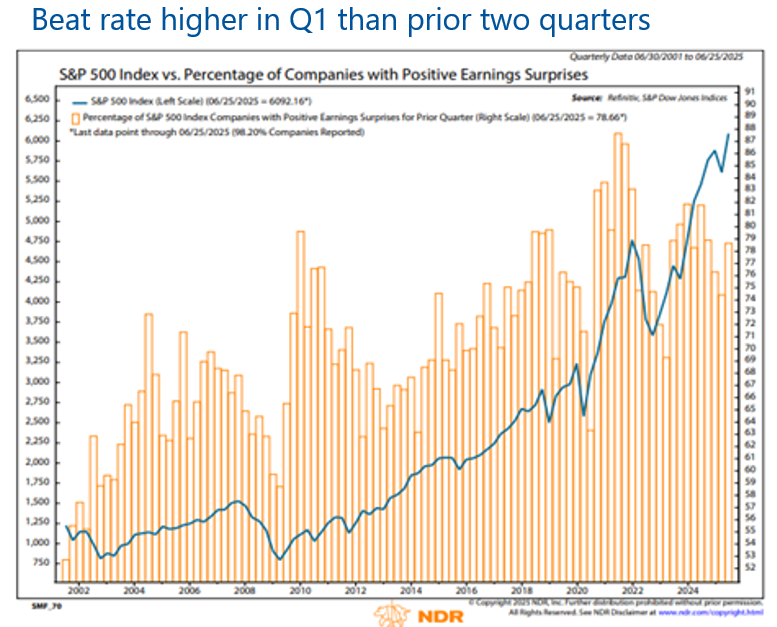
Source: Ned Davis Research (NDR)
President Trump’s erratic tariff rollouts have fueled policy uncertainty, weakening consumer confidence and business investment. The “One Big Beautiful Bill” aims to offset this by expanding the primary budget deficit by $2.4 trillion over the next decade, driven by large tax cuts. Although tariffs aren’t included in the bill, CBO estimates $2.8 trillion in tariff revenue by 2035 could help offset costs. The bill’s tax cuts are front-loaded while spending cuts are delayed, offering a near-term stimulus.
However, the benefits skew toward higher-income households, limiting the impact on overall demand. Temporary provisions through 2028, like bonus depreciation and R&D deductibility, could support capex and growth. If extended, the bill may add more to the deficit. Meanwhile, tariffs raise inflation, with the CBO estimating a 0.4% CPI boost in 2025–26. The combination of rising debt and inflation pressures suggests elevated bond yields may persist, even as stimulus supports modest near-term growth.
In Q2, bonds delivered moderate gains, with the U.S. Aggregate rising 1.2%, less than half of Q1’s performance. Returns varied by maturity, with 3 to 7-year bonds gaining 1.8%, while long-term maturities slipped slightly. Credit markets rebounded, led by high yield up 3.5%, emerging market debt up 2.5%, and leveraged loans up 2.3%. Munis declined again, weighed down by their longer duration, making them the only sector with negative returns in the first half (chart below).
A weaker U.S. dollar boosted international returns, with the Global Aggregate soaring 4.6%. In April, foreign outflows totaled $50 billion, the highest in five years, but were mostly offset by $42.8 billion in repatriation flows. Policy uncertainty may keep upward pressure on yields, but selective opportunities in credit and intermediate maturities could offer better risk-adjusted return.
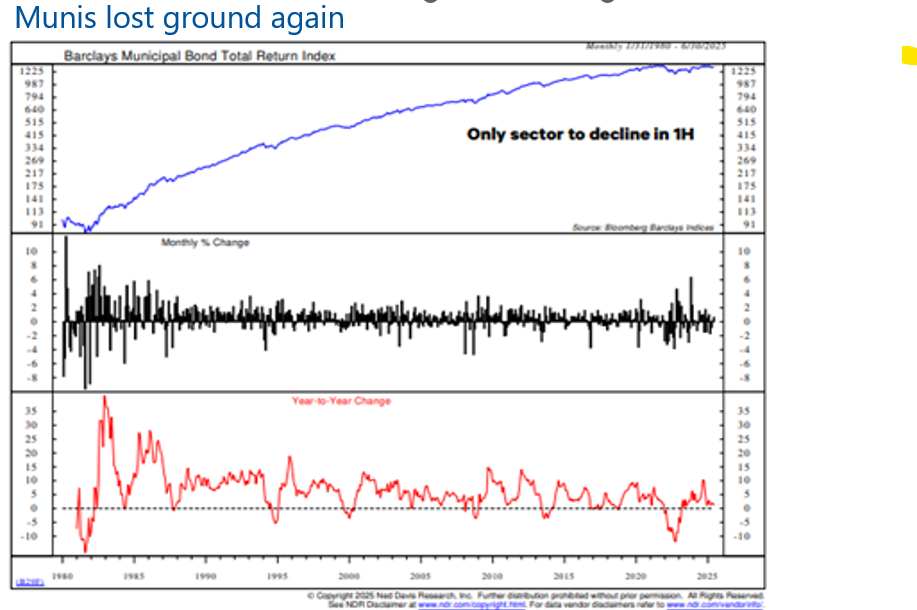
Source: Ned Davis Research (NDR)
Now past mid-year, the global stock market saw early strength, a sharp drop, and a rebound near February highs, driven more by sentiment than data. Uncertainty persists amid ongoing conflicts in the Middle East and Ukraine. If clarity emerges with positive signals like easing inflation and Fed cuts, markets could rally. But if data points to stagflation, failed trade talks, or rising oil, risk-off trends may strengthen. Until indicators clearly align, choppy market action is likely and strong commitment to either bullish or bearish positions remains premature.
Sentiment, rather than fundamentals, may continue to drive market behavior. Despite a brief rise in ETF inflows during May, broader flows remain weak. The 13-week average of ETF and mutual fund flows is still trending downward, reflecting a lack of sustained investor conviction. Seasonality also adds further risk. August and September have been historically weak months, making this a time to be cautious rather than add exposure (chart below). Meanwhile, global growth accelerated for a second month in June, with the composite PMI (an outlook for services and manufacturing) rising to 51.7, moving further away from recession levels.
Europe’s Q2 performance showed typical mean reversion, giving back Q1 gains. Europe ex. U.K. jumped 10.5% in Q2, while the U.K. added 7.6%. Losses in Switzerland and France, which make up over 40% of the index, weighed on results. Emerging markets were in line the global equity index, but still remains the top major region internationally year-to-date with a 9.3% gain. Japan's economy weakened in Q1 with a GDP contraction and continued to struggle in Q2 amid high inflation and rising recession risks.
Looking forward, if global growth continues to firm and inflation pressures ease, global equities could benefit from improved fundamentals and relative valuation support.
Source: Ned Davis Research (NDR)