

First Quarter 2024
The chart below shows last quarter’s performance for five products. The first four, VEA, SPY, BND and VWO, represent four major asset categories and AOR represents a moderate-risk diversified portfolio. This chart provides a visual aid to help identify how major markets and a diversified portfolio performed last quarter.

VEA, FTSE Developed Markets Vanguard: This product represents the developed international equity/stock market.
SPY, S&P 500 SPDR: This product represents the U.S. equity/stock market.
BND, Total Bond Market ETF Vanguard: This product represents the U.S. bond market.
VWO, Emerging Markets ETF MCSI Vanguard: This product represents the emerging equity/stock market.
AOR, Growth Allocation Ishares Core ETF: This product represents a moderate risk diversified portfolio. This product does not necessarily match how your diversified portfolio is allocated. You can find your allocation within this report.
Once again, large U.S. companies (represented by SPY above) continue to lead the pack, up 10.05% for the quarter. International markets were up 1.63% to 4.74% (VWO and VEA). The U.S. bond market was down 1.25% (BND) and moderate risk diversified portfolios finished up 4.66% (AOR). Good quarter for diversified portfolios.
The Federal Reserve
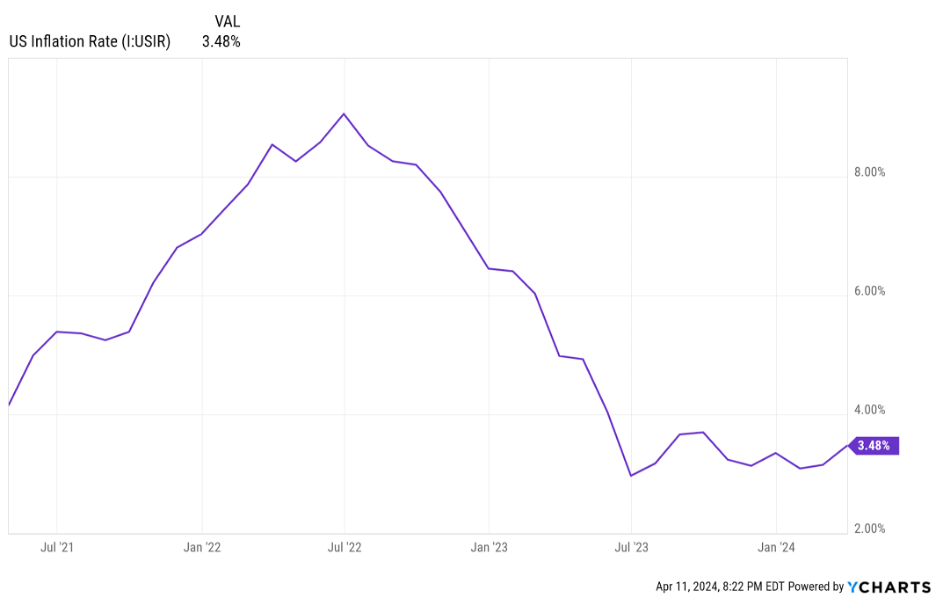
Back in December 2023, the Federal Reserve said that if inflation continues to fall, they expect to reduce interest rates three times in 2024. Investors celebrated the announcement. Below is a 3-year chart of U.S. inflation. Since July 2023, inflation has plateaued and more recently it has experienced a slight uptick. If inflation remains flat or increases, we may need to prepare for “higher rates for longer.” Investors will not be happy. The Fed wants to see inflation at 2.0% and keeping rates higher for longer is a probable outcome provided the job market remains strong. It’s a balancing act.
U.S. National Debt
With the Federal Reserve adjusting interest rates, there's increased focus on the cost of servicing the national debt. Higher interest rates can lead to higher costs for the government to service its debt, which could necessitate cuts to public spending or increases in taxes. According to fiscaldata.treasury.gov the national debt now exceeds $34 trillion. To be exact….
$34,561,015,516,956
The current average interest rate the U.S. is paying to service this debt is 2.97% and climbing. Not a new issue, but one that will be discussed more frequently as we approach the presidential election. I can’t help but wonder if U.S. debt will be downgraded soon by one or more of the rating agencies. This would push U.S. borrowing costs even higher.

S&P 500 Cycle Composite
I’ve shown the chart below before. I like it because it gives us a sense of historical market patterns which might indicate a potential pattern for the current year. We also receive a lot of questions from clients about the impact of presidential elections, which this chart includes. The blue line represents the historical pattern of the S&P500 index (since 1928) and the orange line represents it’s performance so far this year.

If history repeats itself, we may soon be approaching a period of market weakness. In isolation, we would NOT place trades based on this chart, but if our other indicators confirm weakness, then lowering portfolio risk would make sense. This is something we are watching.
Flagship Risk Model
The primary risk model (Ned Davis Research, Davis500) that we use remained in the bullish zone (key level above 1.5) throughout the first quarter. This continues to support our current overweight equity exposure.

Opportunities
International stocks are now 34.5% cheaper than U.S. stocks. This is approaching a 2 standard deviation event (if it reaches 34.8%). Here’s what ChatGPT has to say about 2 standard deviation events: “Thus, a ‘2 standard deviation event’ is relatively rare, comprising about 5% of occurrences, with 2.5% being above the mean plus two standard deviations and another 2.5% being below the mean minus two standard deviations.”
Looking at the chart below you will notice that international stocks are close to fair value. The reason for the wide discrepancy is because U.S. stocks are so expensive. At some point investors may transition out of expensive U.S. stocks and into relatively cheaper international stocks. We are watching this closely.

Hedging Protocol (Risk Management Tool)
Our hedging protocol looks at 49 different indicators that have been selected based on their historical track record at identifying market risk (past performance is not indicative of future results). 34 of these indicators come from Ned Davis Research (NDR), an independent research group, and the remaining 15 were chosen by Stonehearth’s Investment Committee to complement NDR’s indicators. Together they provide us the ability to observe risk as it unfolds to help us determine if trades are needed to manage risk within your diversified portfolio.
Below is our stock/equity exposure for each risk profile for the beginning and the end of the quarter:
· Conservative: Began the quarter at 25.0% and ended the quarter at 30% (benchmark = 30%)
· Moderate: Began the quarter at 61.0% and ended the quarter at 66% (benchmark = 60%)
· Aggressive: Began the quarter at 92.5% and ended the quarter at 95% (benchmark = 85%)
We continue to monitor each of the indicators for guidance on how much risk we should be taking within your portfolio. We will be sure to let you know if/when we make changes to our hedged exposure, but for the time being, we are happy with how we have your portfolio positioned.
Upcoming Events
CIO’s Corner: Quarterly Update Webinar with Chief Investment Officer, Chris Gauthier, CFA
May 1st, 2024, at 12:00 PM EST