

1Q2026 Quarterly Insights Newsletter
U.S. Equities
Main Points
-
The rally on the last day of March helped prevent Q1 from becoming the worst start to a year since the pandemic.
-
Within equities, there were pockets of strength. Five of the nine Russell style boxes and six out of 11 S&P 500 sectors rose.
-
Major indexes including the Nasdaq, Russell 2000, and Dow all experienced corrections of at least 10% during the quarter.
U.S. Sectors
Main Points
-
U.S. sector performance was shaped by sharp commodity moves and geopolitical tensions tied to the conflict with Iran.
-
Energy stocks rose 10% in March and 37% in Q1, the best performing sector over both time frames.
-
Q1 sector leadership reflected a decisive rotation toward Value and inflation beneficiaries.
U.S. Economy & Fixed Income
Main Points
-
The economic impact of a U.S.–Iran conflict depends heavily on its duration and scope.
-
A late quarter rally helped stabilize U.S. fixed income, with the 10-year Treasury yield falling from 4.44% to 4.30%.
-
Treasury floating rate notes led gains, benefiting from reduced expectations for Federal Reserve rate cuts.
International Equities
Main Points
-
The global outlook has become increasingly fragile as the Iran conflict raises geopolitical risk.
-
Emerging Markets and Europe ex U.K. equities outperformed, while the U.S. and the U.K. lagged.
-
2026 appears to be geared towards highlighting interest rates, currencies, inflation, and geopolitics.
Commodities
Main Points
-
Commodities appear to be in a maturing secular bull market, with important divergences across sectors.
-
Energy has re-entered a long-term uptrend after crude surged above $100 amid Middle East disruptions.
-
Copper’s trend could be the “key commodity signal” for anchoring global growth expectations.
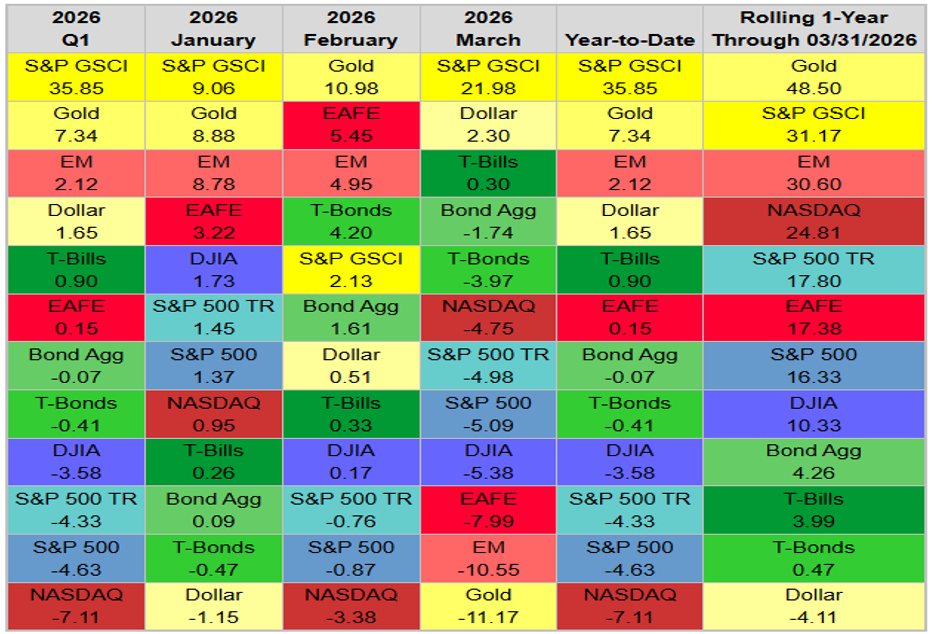
Q1 Asset Class Benchmark Returns
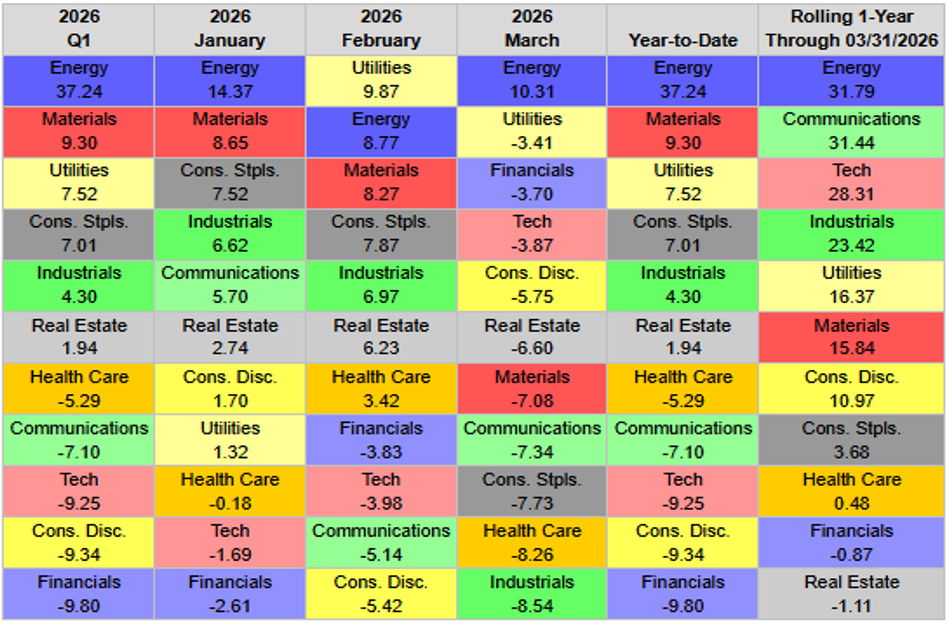
Q1 S&P 500 Sector Returns
The rally on the last day of March helped prevent Q1 from becoming the worst start to a year since the pandemic, but markets still struggled overall. The S&P 500 declined 4.6%, marking its weakest quarter since Q3 2022 and worst first quarter since 2022.
Large-cap growth stocks were hit especially hard, with the Russell 1000 Growth dropping 9.9%, one of the poorest performances relative to value since 1979.
Major indexes including the Nasdaq, Russell 2000, and Dow all experienced corrections of at least 10% during the quarter. Still, market breadth was notable, with over 56% of S&P 500 stocks outperforming the index amid a rotation away from AI related names.
Value stocks outperformed growth across all market caps, while mid- and small-cap stocks generally led large-caps.
Recently, equities have rebounded with resilience despite negative headlines, suggesting investors may have priced in near term geopolitical risks.
However, technical indicators show the rally lacks strong confirmation, with improving but still insufficient breadth and momentum signals to indicate a sustained bullish trend.
Within equities, there were pockets of strength. Five of the nine Russell styleboxes and six out of 11 S&P sectors rose. Over 56% of S&P 500 stocks outperformed the index, the second most in the last 15 years, (chart below). The percentage was over 60% earlier in the quarter amid the rotation out of AI-related names before the broad selloff in March.
Additionally, the conflict in the Middle East has not changed the fact that U.S. midterm elections are less than eight months away. More volatility continues to be the outlook on equities.
56% of stocks beat the S&P 500, the most since 2022
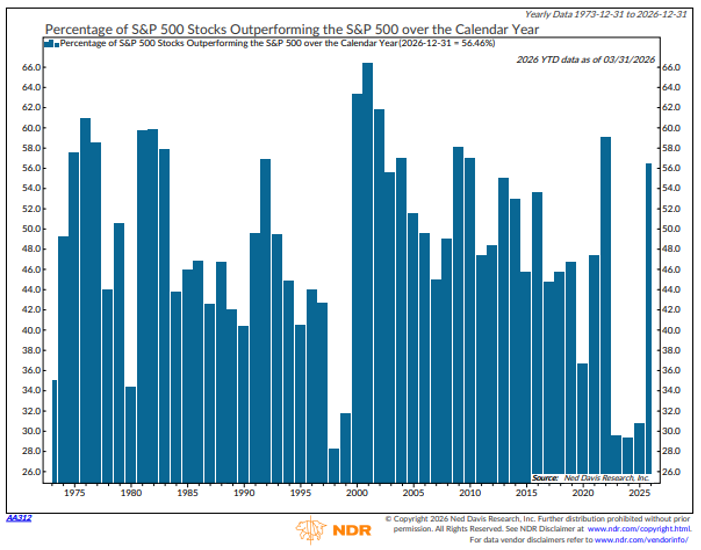
Source: Ned Davis Research (NDR)
In Q1, U.S. sector performance was shaped by sharp commodity moves, rising interest rates, and escalating geopolitical tensions tied to the conflict with Iran. Energy was the clear standout with its second strongest performance since 1972, driven by a surge in crude oil prices that accelerated significantly in March. A mix of cyclical and defensive Value-oriented industries finished as the top performers during the quarter (table across).
Strength was broad within the Energy sector, lifting industries such as oil, gas, and energy services, while major companies like Exxon and Chevron posted sizable gains and helped drive overall index performance. Crude had been on an upward trajectory to begin 2026 even before the war with Iran, but the trend has since been supercharged. West Texas Intermediate, the U.S. benchmark, surged more than 50% in March and gained a total of 77% in Q1. Energy stocks followed suit, rising 10% in March and 37% in Q1, the best performing sector over both time frames.
Beyond Energy, leadership shifted toward Value-oriented sectors, including Materials, Utilities, Consumer Staples, Industrials, and Real Estate, which generated modest positive returns as investors rotated into more defensive and inflation-resilient areas. In contrast, Growth sectors lagged, with Consumer Discretionary, Technology, and Communication Services all declining
meaningfully, reflecting pressure from higher rates and reduced risk appetite. Financials also struggled for much of the quarter due to concerns around private credit, as well as the flattening yield curve driven by shifting expectations for Federal Reserve policy. Market dispersion remained elevated, with six sectors advancing and five declining, highlighting uneven macro conditions.
Overall, Q1 sector leadership reflected a decisive rotation toward Value and inflation beneficiaries.
Cyclical and defensive Value industries led in Q1
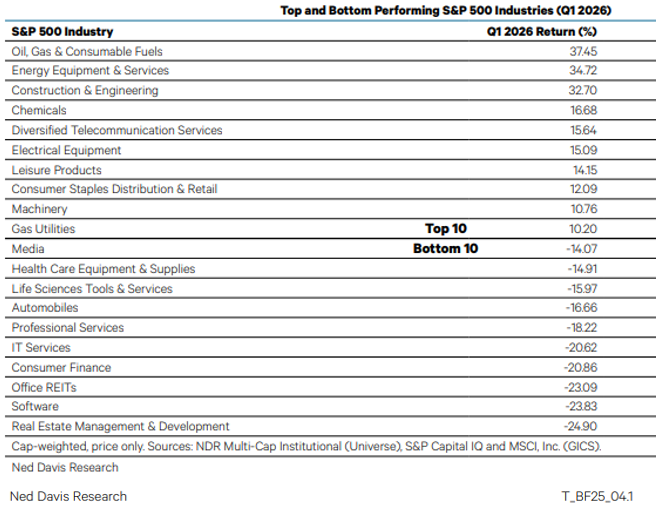
Source: Ned Davis Research (NDR)
The economic impact of a U.S.–Iran conflict would depend heavily on its duration and scope. A short and contained confrontation would likely have only temporary effects, but a prolonged conflict could push oil prices significantly higher, slowing economic growth while increasing inflation and raising stagflation risks. Higher oil prices would quickly translate into increased gasoline costs and ripple through the broader economy via higher production and transportation expenses. Although the U.S. is a major oil producer, domestic prices still track global markets, benefiting energy producers but placing added strain on consumers, particularly lower income households.
Historically, a 10% rise in oil prices adds about 0.1 to 0.2 percentage points to inflation, compounding affordability challenges. At the same time, supply chain disruptions could further intensify inflationary pressures. Economic growth would likely weaken, as higher costs and increased uncertainty weigh on business investment. In addition, rising defense spending could widen fiscal deficits. In this environment, the Federal Reserve would likely remain cautious and delay rate cuts, creating a more difficult backdrop for both the U.S. economy and financial markets.
A late quarter rally helped stabilize U.S. fixed income, with the 10-year Treasury yield falling from 4.44% to 4.30%, as expectations grew that tensions tied to the Iran conflict might ease. The Bloomberg U.S. Aggregate Index finished nearly flat after recovering most of March’s losses. Performance varied widely across sectors. Treasury floating rate notes led gains, benefiting from reduced expectations for Federal Reserve rate cuts. Structured products such as agency mortgage-backed securities (MBS), commercial MBS, and asset-backed securities posted modest gains (chart below).
In contrast, credit sectors declined, with investment grade, high yield, and leveraged loans under pressure.
Structured products notched positive returns
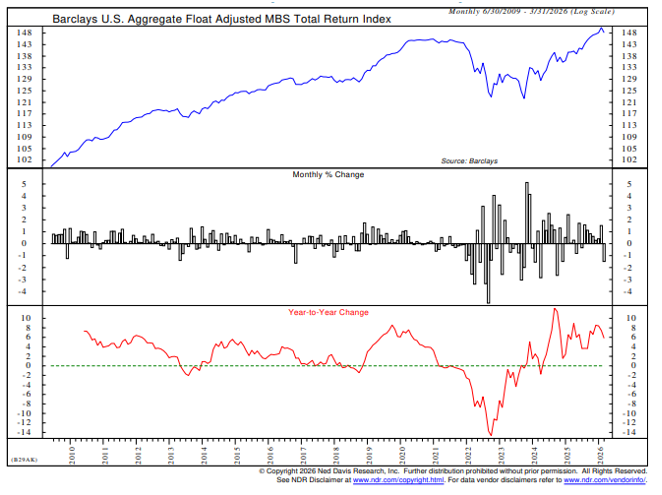
Source: Ned Davis Research (NDR)
The global outlook has become increasingly fragile as the Iran conflict raises geopolitical risk, drives an oil price shock, and heightens the likelihood of a stagflationary environment across major economies (chart across). Before the war, the global economy clocked in another month of strong growth in February, according to the latest global purchasing manager’s index (PMIs). The global composite (services and manufacturing) PMI climbed 0.8 points to 53.3, the highest level since May 2024. This puts the composite significantly above its recessionary threshold of 47.8.
In the U.S., higher crude prices threaten to lift inflation, slow real growth, and delay Federal Reserve rate cuts, keeping long term yields elevated and equities under pressure given already stretched valuations. Canada appears more insulated, as strength in energy production offsets consumer strain, supporting relatively stable growth, though its equity market remains vulnerable to rising yields due to heavy Financials exposure.
Europe faces greater downside risks because of its sensitivity to energy costs, with slowing growth and the potential for renewed inflation.
The U.K. is more exposed to rising oil prices, which could disrupt its recovery and increase inflation pressures. Across Asia, Japan’s improving fundamentals are balanced by energy import risks, while China’s steady growth masks weaker domestic demand and external trade pressures. India remains structurally strong but faces valuation and cost headwinds.
Brazil stands out positively, supported by commodities and favorable valuations.
Despite heightened uncertainty from geopolitical tensions, past patterns suggest markets can remain resilient as long as global growth avoids a sharp downturn, though higher oil prices could still modestly reduce global growth.
Higher oil prices present downside risks to growth
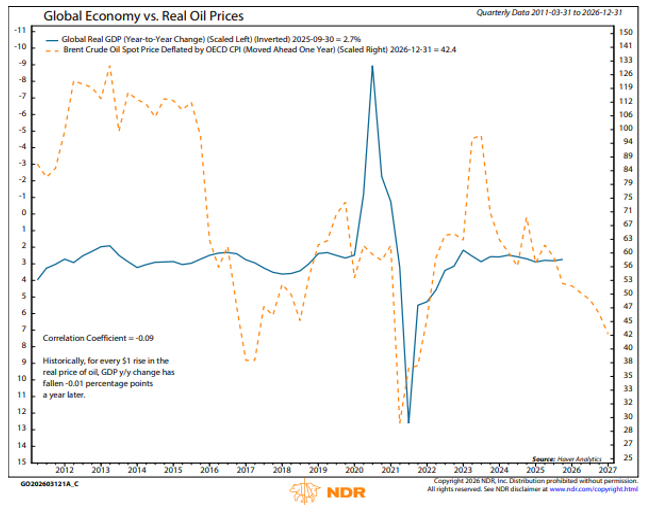
Source: Ned Davis Research (NDR)
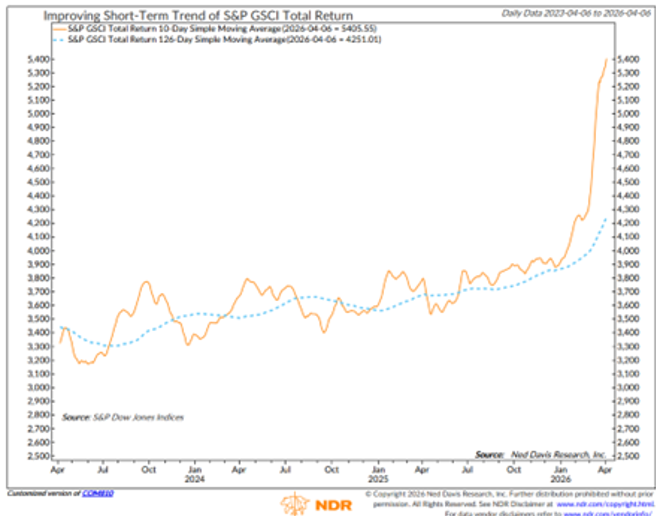
Commodities were up 8.3% in March, the eighth straight month of gains of more than 7% (chart across). The asset class appears to be in a maturing but still intact secular bull market, with important divergences across sectors. Long-term commodity momentum remains firmly positive, with eight consecutive months above 7%, consistent with past secular bulls.
March delivered the strongest commodity breadth in over a year as 76% of the commodities tracked posted gains. It was the best breadth since January 2025 and the third month this year with at least 70% of commodities in positive territory.
However, leadership has shifted. Energy has re-entered a long-term uptrend after crude surged above $100 amid Middle East disruptions, making oil a key swing factor for inflation and growth.
Crude’s path hinges on how long the Iranian conflict persists and how long the Strait of Hormuz remains closed. An extended disruption will likely drive crude prices materially higher.
In contrast, industrial metals—especially copper—look vulnerable near term as high oil prices threaten global growth. Copper’s trend could be the “key commodity signal” for anchoring global growth expectations.
For precious metals, recent volatility has not broken the long-term uptrend. Gold fell 11%, its worst month since 2013, while silver dropped nearly 20%, its steepest decline since September 2011. That year is notable: silver’s prior all time high came in April 2011, marking the end of the last commodity secular bull. Despite the pullbacks, gold and silver remain above their 200-day moving averages.
From a broader asset-allocation perspective, continued allocations to gold are supported by declining real yields and U.S. dollar weakness.
Commodities were up 8.3% in March
Source: Ned Davis Research (NDR)
Source: Ned Davis Research (NDR)
Source: Ned Davis Research (NDR)