3Q2025 Quarterly Insights Newsletter
U.S. Equities
Highlights:
Equities rallied strongly in Q3 despite concerns over tariffs, valuations, and labor.
Emerging markets and gold led gains while the U.S. dollar rebounded modestly.
Small-cap and growth stocks outperformed, driven by earnings momentum and strong liquidity.
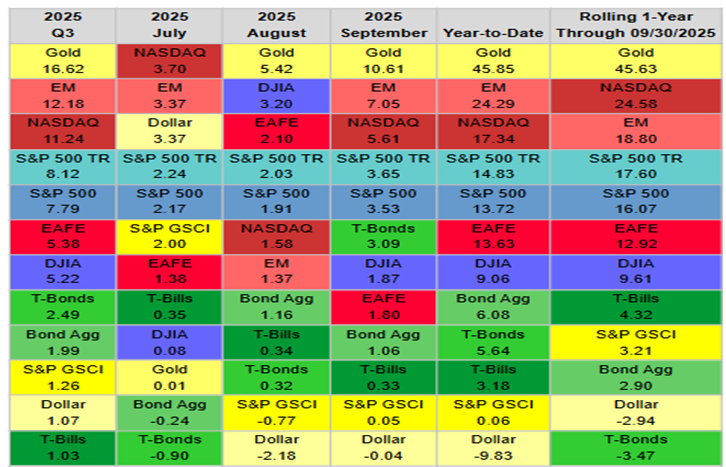
U.S. equities advanced strongly in the third quarter despite several factors that could have weighed on investor sentiment. Tariffs, profit margins, valuations, labor market trends, and questions over Federal Reserve policy independence all contributed to a wall of worry. These risks did not materialize, and stocks rallied as confidence returned. The S&P 500 gained 7.8% in Q3, marking its best third quarter since 2020 and strongest September since 2010. When the index has rebounded from a 10% correction to gain at least 10% through Q3, it has often carried that momentum through year-end (table across).
While seasonal headwinds typically weigh on markets in late September, strong underlying demand helped equities defy expectations. Despite record highs across major indexes, investor sentiment remained surprisingly neutral, suggesting the rally has been driven more by liquidity than euphoria. Robust ETF inflows, near-record corporate buybacks, and limited selling pressure have supported the market’s resilience, with Volume Demand exceeding Volume Supply by one of the widest margins since 2021. At the same time, rising equity issuance hints at renewed corporate confidence and potential valuation awareness. Together, these dynamics point to a market where liquidity and demand remain the dominant forces, sustaining momentum into the year’s final stretch.
Within U.S. markets, small-cap stocks and growth styles led performance. The Russell 2000 rebounded as investors anticipated lower borrowing costs and easier financial conditions. Large-cap growth gained 11.1% and continued to lead year to date with strong earnings and liquidity. Growth factors such as earnings and sales momentum outperformed, while valuation metrics like sales-to-price and EBITDA-to-enterprise value also produced gains. Overall, the third quarter reflected renewed optimism that economic strength could sustain equity market gains into year-end.

U.S. Sectors
Highlights:
Growth sectors led Q3 gains, with Technology, Communication Services, and Consumer Discretionary strongest.
Mega-cap stocks drove market concentration to record levels, highlighting Technology’s continued dominance.
Health Care and defensives lagged as policy uncertainty and rate dynamics shaped sector performance.
Growth leadership that began after the midyear market lows extended through the third quarter, with Technology, Communication Services, and Consumer Discretionary leading performance. Together, these sectors contributed 6.4 percentage points of the S&P 500’s 7.8% gain in Q3, underscoring their influence on market direction. Consumer Staples was the only sector to post a loss during the period, as investors favored higher-growth and cyclical areas. On a year-to-date basis, cyclicals have maintained an advantage, with Communication Services and Technology each up more than 20%. Utilities also performed well, supported by continued investment in artificial intelligence infrastructure. In contrast, low-beta sectors such as Health Care, Consumer Staples, and Real Estate delivered the weakest returns, with Health Care experiencing one of its poorest stretches on record relative to the broader index.
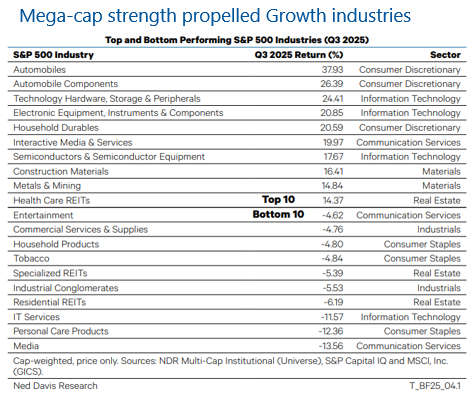
Mega-cap strength was a defining feature of the quarter, as Technology giants again drove market concentration higher (table below). Tesla, Alphabet, Apple, and Nvidia each posted double-digit gains, helping push the top ten S&P 500 stocks to a record 40% share of the index’s market capitalization, the highest level since at least 1972.
Despite the dominance of large growth companies, performance across industries was mixed. Among the ten best-performing groups this year, four came from Growth sectors and six from Value sectors. Metals and Mining led all industries, boosted by a 127% surge in Gold, while Steel and Copper also posted strong advances. The Fed’s September rate cut added another layer of complexity, with sector leadership historically depending on the economy’s strength following such pauses. Health Care remained under pressure due to ongoing policy debates surrounding ACA subsidies, Medicaid spending, and drug pricing. Resolution of these issues could help reduce uncertainty and stabilize performance in the months ahead.
U.S. Economy & Fixed Income
Highlights:
Labor market conditions softened in Q3 as unemployment rose and job openings declined notably.
Hiring momentum weakened alongside slower corporate profit growth and subdued business sentiment.
Bonds advanced as slower growth and renewed Fed rate cuts supported strong duration-driven returns.
Evidence of softening labor market conditions grew more apparent in the third quarter as the balance between labor demand and supply shifted toward emerging slack. The unemployment rate rose to 4.3% in August, exceeding both Congressional Budget Office and Federal Reserve estimates of the full-employment rate. For the first time since 2021, the number of unemployed workers surpassed job openings, underscoring easing labor tightness. A widening unemployment gap typically signals slower growth, weaker demand, and cooling wage pressures. This trend contributed to the Fed’s decision to resume rate cuts after a nine-month pause, with officials projecting two additional reductions this year. While looser policy may help stabilize demand, hiring growth remains constrained by structural labor supply challenges that monetary policy cannot address.
Labor demand has clearly moderated alongside a slowdown in corporate profit growth. Nonfarm payroll gains averaged just 29,000 in August, among the smallest monthly increases of this expansion, and preliminary benchmark revisions indicated a notable downgrade to prior employment estimates. Multiple indicators pointed to weaker hiring momentum, including a declining employment diffusion index, softer ISM employment surveys, and a job openings rate near its lowest level since 2020. Continuing jobless claims have trended higher, while hiring announcements have dropped.
The Float-Adjusted U.S. Aggregate Bond Index gained nearly 2% in Q3 and over 6% year-to-date (chart below). Longer-duration bonds led returns, supported by declining yields, while municipal bonds and investment-grade credit also performed well. High-yield corporates posted modest gains, and emerging market debt outpaced other segments with a 3.4% quarterly return. Despite a modest dollar rebound, U.S. bonds continued to outperform global peers, highlighting the market’s relative strength amid shifting growth and policy expectations.

International Equities
Highlights:
Emerging markets led global equity gains in Q3, driven by China, Taiwan, South Korea, and South Africa.
North America rose steadily while Europe ex-UK lagged, with Southern European markets outperforming regionally.
Broader market breadth remains limited, with earnings momentum slowing and valuations near multi-year lows.
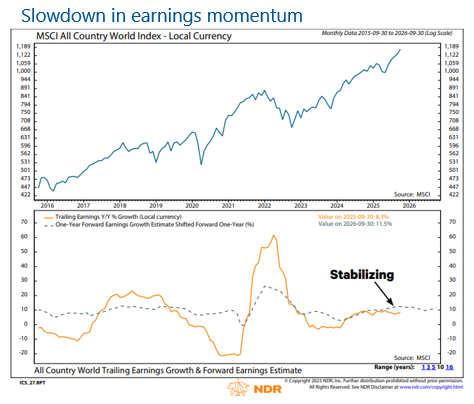
Global equities posted strong gains in the third quarter, with the MSCI All-Country World Index (ACWI) rising 7.6% in local currencies. Emerging markets led performance, climbing 11.6% and contributing to nine of the top ten performing markets in Q3. China was the largest driver, gaining 19.1% for the quarter and 38.3% year-to-date, supported by a surge in Semiconductors & Semiconductor Equipment stocks. Taiwan and South Korea also recorded substantial gains in Information Technology, while South Africa advanced 16.0%, led by Metals & Mining. In contrast, India weighed on emerging markets as its Software and Services sector declined.
Overall, 40 of 47 ACWI markets posted positive returns in Q3. North America delivered solid performance, with Canada up 11.4%, driven by Metals & Mining stocks. Information Technology and Communication Services led U.S. gains, while sector contributions were more balanced year-to-date. Europe ex-UK lagged other regions, gaining only 2.6% and underperforming the ACWI by 4.0% year-to-date. Weakness was broad-based. However, Southern European markets, including Greece, Spain, and Italy, performed strongly, reflecting both sector positioning and local market rebounds.
Despite these gains, broader market breadth remained limited. Fewer than a quarter of ACWI stocks were within 5% of their record highs, and only 15% of U.S. stocks reached 30-day highs. Global earnings momentum has stabilized, with forward growth trends indicating limited acceleration (chart below). Valuations are stretched, with ACWI trailing and forward earnings yields at their lowest levels since 2021. With macro uncertainties from trade, policy, and geopolitical developments, equities remain exposed to potential disappointments in corporate earnings or shifts in economic conditions, which could constrain further upside for global markets.